Preece Family History and One Name Study

The website dedicated to the research of Preece individuals and families worldwide


HOME             BACKGROUND              LOCATIONS              RECORDS              SOURCES              LINKS              MESSAGE BOARD             CONTACT ME


Population Analysis - 1881 - by place of birth and residence

Using the actual number of Preece recorded in the 1881 census is one way of analyzing the population at that time, but it is flawed in that it records all Preece references - including those who started life as Smith, Jones etc. and later married into the Preece name. This section aims to exclude such records, and looks at male Preece records, unmarried females, and of course children.

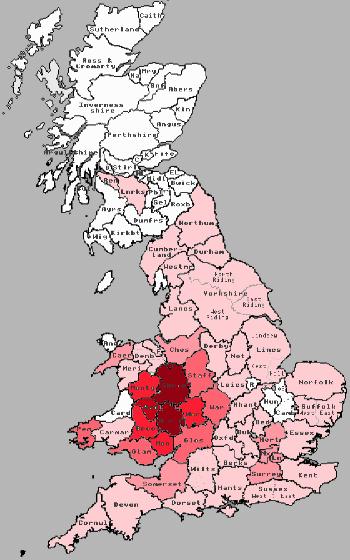
Almost uniquely, Herefordshire shows more people born in the county than living in it, even after adding back the female wives and widows. This reflects the earlier assertion that this county was the main one for Preece at this time, and also the movement away from the county for work, as industrial employment began to expand. Shropshire also shows more people born in the county than in residence, perhaps unsurprising given its border with Herefordshire, and the general movement which had begun towards the growing industrial areas.

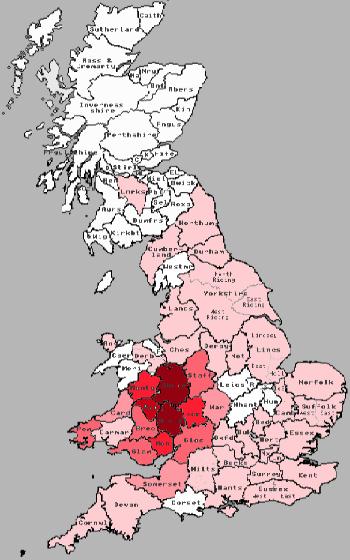
This is well demonstrated by the details for Yorkshire and Lancashire, where more and more Preece families moved towards the end of the 19th century. Looking at the numbers born in the two counties, a marked increase is seen in residence, particularly Yorkshire, and nearby Cheshire also shows a rise, although more modest. This reflects the growing employment in those areas, and census and other records show many Preece families 'migrating' from Midland counties to those further north at this time.

At the other end of the country, the same is true of the two counties making up London, Middlesex and Surrey. Although Preece families had lived in these counties for many years, and the Preece population of Middlesex was, by this time, greater than any of the Welsh counties. Other reasons, such as the use of Price by many families in Wales, contribute to this, but the fact that London was attracting people from across the country is clear, something which has of course continued to the present day. The cost of living in London has now become prohibitively high to many, and it would be interesting to see migration patterns over the next 100 years.

An overall look at the main areas (North East, North West etc.), comparing 1881 and 1999, has been carried out, and can be viewed by clicking here. This study shows some interesting changes in the geographical make-up of the Preece population.

ENGLAND [All figures exclude 'Wives']
1881- by residence
 
1881 - by place of birth
Area/County Number of Preece Population in 000's Preece density per 100k % of total Preece   Number of Preece Population in 000's Preece density per 100k % of total Preece
NORTH EAST  
Durham 19 867 2.2 0.46   19 867 2.2 0.46
Northumberland 4 434 0.9 0.10   2 434 0.5 0.05
NORTH WEST  
Cumberland 3 250 1.2 0.07   1 250 0.4 0.02
Westmorland 0 64 0.0 0.00   0 64 0.0 0.00
Cheshire 38 644 5.9 0.91   28 644 4.3 0.67
Lancashire 93 3454 2.7 2.23   41 3454 1.2 0.99
YORKSHIRE & HUMBER  
Yorkshire 46 2886 1.6 1.10   5 2886 0.2 0.12
EASTERN MIDLANDS  
Rutland 0 21 0.0 0.00   0 21 0.0 0.00
Derbyshire 22 461 4.8 0.53   15 461 3.3 0.36
Leicestershire 4 321 1.2 0.10   0 321 0.0 0.00
Lincolnshire 3 469 0.6 0.07   3 469 0.6 0.07
Northamptonshire 5 272 1.8 0.12   0 272 0.0 0.00
Nottinghamshire 10 391 2.6 0.24   6 391 1.5 0.14
WESTERN MIDLANDS  
Herefordshire 1333 121 1101.7 31.93   1634 121 1350.4 39.35
Shropshire 665 248 268.1 15.93   728 248 293.5 17.53
Staffordshire 325 981 33.1 7.78   264 981 26.9 6.36
Warwickshire 208 737 28.2 4.98   143 737 19.4 3.44
Worcestershire 341 380 89.7 8.17   333 380 87.6 8.02
EAST  
Huntingdonshire 0 59 0.0 0.00   0 59 0.0 0.00
Bedfordshire 1 149 0.7 0.02   2 149 1.3 0.05
Cambridgeshire 0 185 0.0 0.00   3 185 1.6 0.07
Essex 15 576 2.6 0.35   15 576 2.6 0.36
Hertfordshire 12 203 5.9 0.29   6 203 3.0 0.14
Norfolk 1 444 0.2 0.02   2 444 0.5 0.05
Suffolk 4 356 1.1 0.10   5 356 1.4 0.12
LONDON & SOUTH EAST  
Berkshire 10 218 4.6 0.24   6 218 2.8 0.14
Middlesex 185 2920 6.3 4.43   137 2920 4.7 3.30
Sussex 10 490 2.0 0.24   3 490 0.6 0.07
Buckinghamshire 6 176 3.4 0.14   3 176 1.7 0.07
Hampshire 6 593 1.0 0.14   7 593 1.2 0.17
Kent 10 977 1.0 0.24   13 977 1.3 0.31
Oxfordshire 5 179 2.8 0.12   7 179 3.9 0.17
Surrey 103 1436 7.2 2.47   69 1436 4.8 1.66
SOUTH WEST  
Cornwall 1 330 0.3 0.02   4 330 1.2 0.10
Devon 24 603 4.0 0.57   14 603 2.3 0.34
Dorset 2 191 1.0 0.05   0 191 0.0 0.00
Gloucestershire 193 572 33.7 4.62   181 572 31.6 4.36
Somerset 30 469 6.4 0.72   60 469 12.8 1.45
Wiltshire 2 258 0.8 0.05   2 258 0.8 0.05
 
ENGLAND TOTALS 3739 24385 15.3 89.56   3761 24385 15.4 90.58

WALES [All figures exclude 'Wives']
1881 - by residence
 
1881 - by place of birth
 Area/County Number of Preece Population in 000's Preece density per 100k % of total Preece   Number of Preece Population in 000's Preece density per 100k % of total Preece
Brecon 35 58 60.3 0.84   22 58 37.9 0.53
Caernarvonshire 7 118 5.9 0.17   0 118 0.0 0.00
Cardiganshire 0 71 0.0 0.00   4 71 5.6 0.10
Carmarthenshire 6 123 4.9 0.14   6 123 4.9 0.14
Denbighshire 1 110 0.9 0.02   3 110 2.7 0.07
Flintshire 3 78 3.8 0.07   0 78 0.0 0.00
Glamorgan 133 509 26.1 3.19   116 509 22.8 2.79
Isle of Anglesey 0 51 0.0 0.00   2 51 3.9 0.05
Merionethshire 1 53 1.9 0.02   0 53 0.0 0.00
Monmouthshire 142 211 67.3 3.40   119 211 56.4 2.87
Montgomeryshire 51 66 77.3 1.22   56 66 84.8 1.35
Pembrokeshire 24 92 26.1 0.57   27 92 29.3 0.65
Radnorshire 30 23 130.4 0.72   34 23 147.8 0.82
 
WALES TOTALS 433 1563 27.7 10.37   389 1563 24.9 9.37

SCOTLAND [All figures excludes 'Wives']
1881 - by residence
 
1881- by place of birth
 Area/County Number of Preece Population in 000's Preece density per 100k % of total Preece   Number of Preece Population in 000's Preece density per 100k % of total Preece
Aberdeenshire 0 271 0.0 0.00   0 271 0.0 0.00
Angus 0 271 0.0 0.00   0 271 0.0 0.00
Argyll & Bute 0 99 0.0 0.00   0 99 0.0 0.00
Ayrshire 0 220 0.0 0.00   0 220 0.0 0.00
Banffshire 0 60 0.0 0.00   0 60 0.0 0.00
Berwick 0 35 0.0 0.00   0 35 0.0 0.00
Caithness 0 40 0.0 0.00   0 40 0.0 0.00
Clackmannanshire 0 24 0.0 0.00   0 24 0.0 0.00
Dunbartonshire 0 79 0.0 0.00   0 79 0.0 0.00
Dumfries-shire 0 65 0.0 0.00   0 65 0.0 0.00
East Lothian 0 39 0.0 0.00   0 39 0.0 0.00
Fife 0 174 0.0 0.00   0 174 0.0 0.00
Inverness-shire 0 89 0.0 0.00   0 89 0.0 0.00
Kincardineshire 0 35 0.0 0.00   0 35 0.0 0.00
Kircudbrightshire 0 42 0.0 0.00   0 42 0.0 0.00
Lanarkshire 2 955 0.2 0.05   2 955 0.2 0.05
Midlothian 0 392 0.0 0.00   0 392 0.0 0.00
Moray 0 45 0.0 0.00   0 45 0.0 0.00
Nairnshire 0 8 0.0 0.00   0 8 0.0 0.00
Orkney Islands 0 32 0.0 0.00   0 32 0.0 0.00
Peeblesshire 0 13 0.0 0.00   0 13 0.0 0.00
Perth & Kinross 0 139 0.0 0.00   0 139 0.0 0.00
Renfrewshire 1 229 0.4 0.02   0 229 0.0 0.00
Ross & Cromarty 0 80 0.0 0.00   0 80 0.0 0.00
Roxburgh 0 53 0.0 0.00   0 53 0.0 0.00
Selkirkshire 0 26 0.0 0.00   0 26 0.0 0.00
Shetland Islands 0 30 0.0 0.00   0 30 0.0 0.00
Stirling 0 108 0.0 0.00   0 108 0.0 0.00
Sutherland 0 22 0.0 0.00   0 22 0.0 0.00
West Lothian 0 44 0.0 0.00   0 44 0.0 0.00
Wigtown 0 38 0.0 0.00   0 38 0.0 0.00
 
SCOTLAND TOTALS 3 3757 0.1 0.07   2 3757 0.1 0.05
 
BRITISH TOTALS 4175 29705 14.1 100.00   4152 29705 14.0 100.00


Preece population comparison - 1881 - by place of residence and birth
1881 - by place of residence at census date
1881 - by place of birth from census data


Counties shown graded by numerical total of Preece in each county :-

<5     5 - 19     20 - 49     50 - 99     100-249     250+